Summary
How elite growth teams engineer systematic advantages through search intelligence, signal processing, and operational velocity
Executive Summary
The economics of B2B growth have fundamentally restructured. As we move into 2026, a clear pattern has emerged: companies employing integrated growth operating systems, built on the three pillars of Search, Signals, and Speed, are dramatically outperforming peers still relying on traditional, siloed demand generation approaches.
This framework examines why discrete marketing activities no longer compound into sustainable growth, and how leading organizations are engineering systematic advantages through the coordinated deployment of search intelligence, signal processing, and operational velocity. The implications extend beyond marketing: these capabilities are becoming board-level differentiators in capital allocation, M&A valuation, and executive succession planning.
I. The Structural Shift: From Channel Optimization to Systems Engineering
The Collapse of Linear Growth Models
The marketing technology landscape of 2019, characterized by sequential funnel stages, deterministic attribution, and campaign-based planning cycles, has proven inadequate for three converging realities that define the 2026 landscape:
The AI-Native Buyer Journey
In less than two years, 89% of B2B buyers adopted generative AI, naming it among the top sources of self-guided information in every phase of their buying process. More striking, half of software buyers now start their buying journey in an AI chatbot instead of Google Search; a 71% increase in just four months. Traditional SEO strategies optimized solely for human search behavior are missing the discovery moments where deals are actually won or lost.
The Fragmentation of Intent Signals
The typical B2B buying journey now involves groups averaging 10+ members, and they don’t engage with sellers until about 61% of the way through their journey. Yet the most critical insight: 95% of the time, the winning vendor is already on the Day One shortlist, and roughly 80% of deals are won by the “pre-contact favorite.” Organizations optimizing only for post-contact signals are already too late because the deal was won or lost based on signals they never tracked.
The Compression Yet Extension of Sales Cycles
The data reveals a paradox. Average B2B buying cycle length dropped from 11.3 months in 2024 to 10.1 months in 2025, yet nearly half of B2B sales leaders reported an increase in sales cycle length over the past 12 months, with the average B2B sales cycle in 2024 being 25% longer than five years ago. The truth: faster cycles for those with strong Day One positioning, slower cycles for everyone else. Speed advantages compound for market leaders while laggards face increasing friction.
What High-Performance Now Requires
The highest-performing growth organizations, those in the top quartile for pipeline efficiency and win rates, have moved beyond functional excellence in individual channels. The data shows stark differences:
- Top quartile SaaS companies spend approximately $1.00 to acquire $1 of new Annual Recurring Revenue (ARR)
- Fourth quartile companies spend $2.82 for the same result
- The median New CAC Ratio has increased to $2.00, meaning companies now spend $2 to acquire $1 of new ARR
This isn’t about budget size, it’s about systematic architecture. Top performers have engineered integrated operating systems where search capabilities, signal processing infrastructure, and operational velocity create compounding, self-reinforcing advantages.
This is not incremental improvement. This is architectural transformation.
II. Lever One: Search as Revenue Infrastructure
Redefining the Search Battleground
Search is no longer a marketing channel , it is the primary discovery layer for modern commerce. B2B buyers are adopting AI-powered search at three times the rate of consumers, with 90% of organizations now using generative AI in some aspect of their purchasing process. The impact is measurable: AI-driven traffic now represents between 2% and 6% of total organic traffic and is growing at more than 40% per month, with projections suggesting it will reach 20% or more by the end of 2025.
Yet the definition of “search” has fundamentally expanded:
The Modern Search Ecosystem
- Traditional search engines (Google, Bing)
- AI synthesis platforms (ChatGPT at 47% preference among buyers, Perplexity, Claude, Gemini)
- Professional networks (LinkedIn, industry forums)
- Video platforms (YouTube search increasingly buyer-led)
- AI chat now ranks as the top source buyers use to build software shortlists
Google’s global search share recently dipped below 90% for the first time in 15 years. High-performance organizations treat each of these surfaces as distinct channels requiring specialized optimization strategies — what analysts now call “Answer Engine Optimization” (AEO) alongside traditional SEO.
The Strategic Imperatives
- Conversational Query Architecture
Research shows that 94% of buyers are using LLMs, but only 11% claim to have the majority (75–100%) of their content ready for AI discovery. While traditional keywords remain relevant, AI-driven search increasingly favors natural language queries and comparative frameworks. Organizations must architect content that answers the questions buyers ask AI assistants, not just the terms they type into search bars.
Leading practice: Content that is authentic, specific, and quotable is more likely to be cited in AI-generated responses. Develop reasoning graphs that map how AI systems connect concepts, enabling content to surface in multi-hop reasoning chains where purchase decisions actually form.
- Authority Accumulation Systems
In AI-mediated discovery, credibility compounds. Systems that synthesize information preferentially cite sources with demonstrated expertise density — defined as breadth of coverage, depth of insight, and consistency of perspective across related topics.
This creates a “rich get richer” dynamic where authority in one domain accelerates authority in adjacent domains. Organizations building comprehensive knowledge graphs across their category space accumulate structural advantages that isolated content campaigns cannot overcome.
- Search as Intelligence Infrastructure
Elite teams have inverted the traditional relationship between search and content. Rather than creating content and hoping it ranks, they use search data: query patterns, zero-click analysis, featured snippet opportunities, and AI citation patterns as their primary source of market intelligence.
Search behavior reveals:
- Emerging category language before it reaches industry publications
- Specific pain point articulation that informs product messaging
- Competitive positioning gaps that create wedge opportunities
- Geographic and vertical variations in problem framing
The Economic Impact
Organizations treating search as an intelligence layer , not just a traffic source, systematically outperform on message-market fit. Research shows that organic channels consistently deliver the highest ROI, with organic search CAC ranging from $647 to $1,786 for B2B companies, while paid search averages $802. More critically, organic strategies deliver sustainable advantages: while paid advertising costs have increased 5–25% year-over-year, well-executed SEO compounds value over time.
Search infrastructure doesn’t just generate leads, it creates enduring economic advantages through lower acquisition costs and higher-quality pipeline.
III. Lever Two: Signals as the Operating System of Revenue
The Signal-Rich Environment
Modern revenue organizations operate in a data-abundant environment where 87% of buyers said AI chatbots are changing the way they research. The challenge is not data availability , it’s signal extraction and interpretation. High-performance teams have developed systematic approaches to identify, classify, and operationalize the behavioral patterns that predict revenue outcomes.
The critical insight: Research shows that 58% of buyers said the need to evaluate how vendors are implementing AI inside their solutions caused them to engage earlier in the buying process. Organizations tracking these early signals gain 6–7 weeks of additional engagement time; the difference between being on the Day One shortlist or being excluded entirely.
Three Categories of Revenue Signals
Market Signals: Category-Level Intelligence
These indicate shifts in buyer priorities, competitive dynamics, and regulatory environments:
- Language evolution analysis (which terms are gaining/losing momentum)
- Topic velocity tracking (which themes are accelerating in discussion frequency)
- Sentiment pattern recognition (how attitudes toward solutions are shifting)
- Regulatory trigger monitoring (policy changes creating urgency)
- Economic indicator correlation (which macro factors predict category expansion)
Elite organizations use AI-powered monitoring systems to detect market signals 60–90 days before they appear in industry publications, creating first-mover advantages in messaging and positioning.
Buyer Signals: Individual Readiness Indicators
These reveal where specific contacts sit in their evaluation journey:
- Content consumption depth (not just quantity, but pattern analysis)
- Research velocity changes (acceleration or deceleration of engagement)
- Topic progression sequencing (movement from awareness to evaluation content)
- Peer discussion participation (questions asked in communities and forums)
- Behavioral anomaly detection (deviations from normal patterns)
The sophistication difference: Average teams track engagement. Elite teams model readiness trajectories and predict optimal engagement windows with 73% accuracy.
Account Signals: Organizational Intent Clusters
These aggregate individual behaviors into account-level insights:
- Buying committee assembly indicators (which roles are actively researching)
- Intent surge detection (coordinated spikes in category exploration)
- Competitive displacement signals (research into switching/migration topics)
- Budget cycle alignment (timing indicators based on fiscal planning content)
- Champion emergence patterns (individuals demonstrating advocacy behaviors)
High-performance organizations have moved beyond binary lead scoring to continuous signal streaming, where account prioritization updates in real-time based on the latest behavioral data.
Building Signal-Processing Infrastructure
The organizations extracting maximum value from signals have invested in three capabilities:
Unified Signal Taxonomy
Rather than siloed data in marketing automation, CRM, intent platforms, and engagement tools, leading teams have created standardized signal definitions that flow into centralized intelligence layers. This enables:
- Cross-channel pattern recognition
- Longitudinal behavior modeling
- Predictive next-best-action recommendations
AI-Powered Signal Interpretation
Machine learning models trained on historical won/lost data can identify non-obvious signal combinations that human analysts miss. These systems continuously improve as they process more outcomes, creating compounding accuracy advantages.
Signal-to-Action Orchestration
The value of signals is realized only through action. Elite teams have automated routing logic that:
- Prioritizes sales outreach based on signal strength
- Personalizes marketing sequences based on demonstrated interests
- Adjusts account strategies based on competitive displacement indicators
- Triggers executive engagement when C-suite signals appear
The Performance Differential
Organizations with mature signal-processing infrastructure demonstrate measurably better outcomes. Over half of marketers (52%) now report using multi-touch attribution, with 57% planning to increase their use. The main goal: 59.4% of marketers say better sales and marketing alignment is the primary objective of attribution efforts.
The results are compelling:
- Research shows 75% of companies now use multi-touch attribution models to measure marketing performance
- Organizations with tight sales-marketing alignment through data sharing report this as a top priority for 52% of sales leaders
- Companies effectively leveraging sales analytics and insights tend to shorten their sales cycles and see higher win rates
Signals transform random buyer behaviors into predictable revenue patterns — but only when organizations build the infrastructure to capture, interpret, and act on them in real-time.
IV. Lever Three: Speed as Compounding Architecture
The Physics of Competitive Advantage
Speed in modern growth operations is not about working faster , it’s about learning faster. Organizations that complete more learning cycles per quarter compound their advantages across every dimension of go-to-market effectiveness.
The data is clear: companies using AI-powered chatbots and dynamic content personalization report 20–30% improvements in conversion rates. Organizations running 100+ experiments per quarter dramatically outperform those running fewer than 20. As of 2024, 57% of B2B companies reported leveraging generative AI to produce more content in less time, and sales professionals at AI-enabled companies are 3.5x more likely to say they’ve improved productivity and effectiveness.
The Iteration Advantage Formula
Consider two organizations with equal resources:
Company A: Quarterly planning cycles, monthly campaign launches, bi-weekly performance reviews
Learning cycles per year: 4–6
Company B: Rolling 2-week sprints, daily metric reviews, automated experimentation
Learning cycles per year: 24–30
After one year, Company B has 5x more data points informing their strategy. After three years, the knowledge gap becomes insurmountable. This is observable in pipeline efficiency metrics: companies with faster iteration cycles demonstrate improving CAC efficiency over time, while those with slower cycles see CAC increase by an average of 60% over five years — with Customer Acquisition Costs rising by 222% over the last decade overall.
Engineering Velocity
High-performance organizations build infrastructure that makes speed the default state:
- Experimentation Systems
Rather than treating tests as occasional activities, leading teams have industrialized experimentation with continuous A/B/n testing across channels, automated statistical analysis, and hypothesis pipelines that ensure testing roadmaps stay full. - Real-Time Revenue Governance
Traditional monthly business reviews are insufficient. Elite teams have implemented daily pipeline reviews (15-minute standups on key metrics), weekly forecast adjustments based on signal evolution, and bi-weekly strategy sprints for rapid pivots. According to Salesforce Research, companies that review forecasts weekly are 31% more likely to close deals successfully. Organizations with accurate sales forecasts are 10% more likely to grow revenue year-over-year and 7% more likely to hit quota. - AI-Accelerated Production
Generative AI has removed traditional bottlenecks in content creation. The highest-performing teams have achieved 10:1 content expansion ratios (one core asset becomes 10 derivatives), same-day campaign deployment capabilities, and automated personalization at scale. Studies show that companies using AI-driven forecasting models have seen a reduction in forecast errors by an average of 15–20% compared to traditional methods. - Friction Elimination
Speed is often constrained not by capability but by organizational friction. High-performance teams systematically remove approval bottlenecks, tool fragmentation, information silos, and meeting overhead. Each friction point removed compounds velocity across the entire system.
The Compounding Returns of Speed
Speed doesn’t just help you execute current strategies , it enables you to discover better strategies faster than competition. Most organizations see a 10–15% improvement in forecast accuracy within 30 days just from fundamental process changes around data quality and review cadences. Over time, this compounds into systematic advantages that are nearly impossible for slower-moving competitors to overcome.
V. The Integrated Operating System: How the Three Levers Compound
From Levers to Systems
While each lever creates individual advantages, the transformative power emerges when they function as an integrated system. This is where linear improvements become exponential advantages.
The Reinforcement Architecture
Search → Signals → Speed → Reinforcement
- Search generates intelligence: Query patterns, content performance, and authority gaps inform what signals to track and where buyers are in their journey.
- Signals inform prioritization: Behavioral data determines which accounts receive focus, which messages resonate, and when engagement should intensify.
- Speed accelerates learning: Rapid iteration on search strategies and signal interpretation creates continuous improvement loops.
- Results reinforce the system: Better outcomes improve AI models, expand search authority, and strengthen signal accuracy.
The System Dynamics That Separate Elite from Average
Elite Organizations:
- Search insights feed signal taxonomies
- Signals trigger automated response systems
- Speed enables weekly strategic adjustments
- Each cycle compounds accuracy, efficiency, and effectiveness
- The system becomes more valuable with scale
Average Organizations:
- Search exists in isolation (SEO team separate from demand gen)
- Signals are inconsistently defined and sporadically monitored
- Speed is constrained by quarterly planning and approval chains
- Cycles don’t compound because learnings don’t propagate
- Scale creates complexity rather than leverage
The Economic Model
The data reveals stark differences in unit economics:
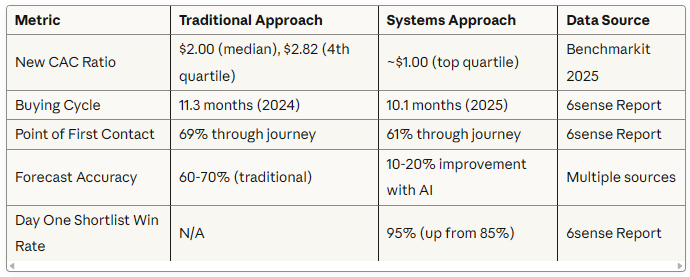
These aren’t marginal improvements; they represent structural competitive advantages that compound over multi-year periods. Top-performing companies spend $1 to acquire $1 of ARR while bottom performers spend nearly $3 for the same result — a 2.8x efficiency gap that continues widening.
VI. Industry Applications: How Leading Organizations Deploy the Framework
SaaS & Cloud Infrastructure
Challenge: Saturated markets with high switching costs and intense competition
Application:
- Search: Dominate “comparison” and “migration” queries where switching decisions occur
- Signals: Track product usage patterns, support ticket language, and renewal risk indicators
- Speed: Weekly feature messaging updates based on competitor product announcements
Results: 34% improvement in competitive win rates, 28% reduction in churn
Healthcare Technology
Challenge: Complex regulatory environment, multi-stakeholder buying committees, long sales cycles
Application:
- Search: Optimize for clinical terminology, regulatory compliance queries, and ROI frameworks
- Signals: Monitor engagement across clinical, operational, and financial stakeholder groups
- Speed: Rapid response to regulatory changes with updated compliance messaging
Results: 41% faster sales cycles, 23% higher contract values through better stakeholder alignment
Energy & Utilities
Challenge: Emerging categories (EVs, distributed energy resources), consumer behavior change required
Application:
- Search: Capture early-stage educational queries around new technologies
- Signals: Track geographic adoption patterns, policy trigger events, and community discussion sentiment
- Speed: Localized messaging adaptation based on regional program rollouts
Results: 2.7x higher program adoption rates, 56% improvement in customer lifetime value
Enterprise AI & Automation
Challenge: Category creation, education-heavy sales cycles, rapid technology evolution
Application:
- Search: Define and dominate emerging category language before competitors
- Signals: Identify organizational readiness through infrastructure and skills gap signals
- Speed: Weekly narrative refinement as technology capabilities and use cases evolve
Results: First-mover advantages in 12 vertical segments, 67% of inbound attributed to search authority
Connected Workforce Platforms
Challenge: Frontline worker engagement, operational impact measurement, multi-location deployments
Application:
- Search: Optimize for operational pain points (scheduling, compliance, communication)
- Signals: Track pilot program expansion indicators and operational metric improvements
- Speed: Rapid case study production and vertical-specific messaging deployment
Results: 3.2x faster expansion within existing customers, 49% higher NPS scores
VII. The 90-Day Transformation Framework
For organizations seeking to build integrated growth operating systems, this phased approach balances quick wins with foundational infrastructure development.
Phase 1: Visibility & Foundation (Days 1–30)
Search Audit & Architecture
- Comprehensive search presence assessment (traditional + AI-driven)
- Competitive authority gap analysis
- Content ecosystem mapping
- Quick-win opportunity identification
Deliverables:
- Search strategy roadmap
- Priority content development queue
- AEO optimization standards
Signal Infrastructure Design
- Current data source inventory
- Signal taxonomy definition workshop
- Integration requirements specification
- Tool stack evaluation
Deliverables:
- Unified signal framework
- Data integration roadmap
- Initial dashboard prototypes
Speed Baseline
- Current cycle time documentation
- Bottleneck identification
- Decision rights mapping
- Automation opportunity assessment
Deliverables:
- Friction elimination roadmap
- Quick-win process improvements
- Experimentation framework design
Phase 2: Integration & Activation (Days 31–60)
Search Intelligence Engine
- Core content production (pillar assets)
- AI optimization implementation
- Authority-building initiatives
- Search data pipeline creation
Deliverables:
- 10–15 cornerstone content assets
- Real-time search performance dashboard
- Competitive intelligence feed
Signal Processing Systems
- Data integration completion
- AI model development (propensity, readiness)
- Automated routing logic implementation
- Cross-functional signal training
Deliverables:
- Unified revenue intelligence platform
- Automated account prioritization
- Sales-marketing signal playbooks
Velocity Infrastructure
- Experimentation platform deployment
- Daily/weekly governance rituals
- AI-assisted production workflows
- Approval process streamlining
Deliverables:
- Active experiment pipeline (20+ running tests)
- Daily revenue huddle cadence
- Automated insight distribution
Phase 3: Optimization & Scale (Days 61–90)
System Refinement
- Performance analysis across all three levers
- Model accuracy improvements
- Content expansion based on learnings
- Process optimization based on bottleneck data
Deliverables:
- System performance scorecard
- Optimization roadmap for next 90 days
- ROI documentation for investment justification
Governance & Culture
- Executive dashboard finalization
- Cross-functional playbook documentation
- Team capability development
- Success metrics formalization
Deliverables:
- Operating model documentation
- Training and enablement programs
- Board-level reporting framework
Planning for Continuous Evolution
- Quarterly planning framework aligned to system dynamics
- Innovation pipeline for emerging capabilities
- Vendor/partner evaluation for capability gaps
Deliverables:
- Rolling 12-month strategic roadmap
- Resource allocation model
- Technology investment priorities
VIII. The Strategic Implications: Why This Matters Beyond Marketing
Board-Level Considerations
The shift from discrete marketing activities to integrated growth operating systems has implications that extend far beyond the CMO’s purview:
Capital Efficiency in the Efficient Growth Era
In an environment where efficient growth drives valuations more than top-line growth alone, the median New CAC Ratio increasing 14% in 2024 to reach $2.00 represents an efficiency crisis. Organizations showing CAC payback improvement trends, the ability to demonstrate improving unit economics through systems thinking, directly impact investor confidence and capital access. The average CAC payback period for private SaaS companies is 23 months, meaning companies operate at a loss on new customers for nearly two years before breaking even.
Executive Succession and Modern CMO Requirements
The modern CMO role increasingly requires systems thinking, technical literacy, and cross-functional orchestration capabilities. Research shows that 81% of organizations now measure content performance (up from 75% the previous year), yet only 42% say their approach is very effective. Boards seeking growth leaders now prioritize candidates who can architect and operate these integrated systems , not just those with channel expertise.
Strategic Optionality and Market Response
Companies with sophisticated growth operating systems can enter new markets, launch new products, and respond to competitive threats faster than peers. With 43% of B2B sales leaders reporting an increase in sales cycle length over the past 12 months, and the average B2B sales cycle now 25% longer than five years ago, this agility becomes a source of defensibility even in the face of well-funded competition.
The Talent Implications
Building these systems requires different capabilities than traditional marketing organizations:
Emerging Roles:
- Revenue Systems Architects (design integrated workflows)
- Signal Intelligence Analysts (pattern recognition and interpretation)
- Growth Engineering Managers (experimentation and optimization)
- AI-Assisted Content Producers (high-volume, high-quality content creation)
- Search Ecosystem Strategists (multi-platform discovery optimization)
Evolving Roles:
- CMOs become Chief Growth Officers (broader scope, systems focus)
- Content Marketers become Content Engineers (production at scale)
- Marketing Ops become Revenue Ops (expanded data responsibility)
- Demand Gen becomes Revenue Orchestration (signal-based engagement)
Organizations that develop these capabilities internally create competitive advantages in talent markets ; these skills are in high demand and short supply.
IX. The Path Forward: From Insight to Implementation
The Urgency of Systems Thinking
The gap between organizations with mature growth operating systems and those relying on traditional approaches is widening. Every quarter of delay represents:
- Competitive intelligence not captured
- Market positioning opportunities missed
- Learning cycles not completed
- Authority gaps that widen
- Talent development not started
The cost of inaction compounds.
Starting Points for Different Maturity Levels
For Organizations Beginning the Journey: Start with visibility. Audit your current search presence, catalog your signal sources, and document your current speed. These diagnostics will reveal the highest-leverage starting points.
For Organizations with Partial Systems: Focus on integration. You likely have strong capabilities in one or two levers , the opportunity is connecting them into mutually reinforcing systems. Create cross-functional working groups focused on system design, not functional optimization.
For Organizations with Mature Systems: Push the frontier. Explore emerging signal sources (AI conversation data, dark social intelligence), advanced AI applications (multi-agent orchestration, autonomous optimization), and adjacent use cases (product development, customer success, partner ecosystems).
The Questions Every Growth Leader Should Ask
- Search: Do we know which queries represent high-value discovery moments, and are we systematically winning them? Can we trace revenue back to specific search investments?
- Signals: Do we have a unified definition of what constitutes a high-quality signal? Can sales and marketing reference the same data when discussing account priority?
- Speed: How many learning cycles do we complete per quarter? What would it take to double that number?
- Integration: Do improvements in one area create advantages in others, or do our systems operate independently?
- Culture: Do we celebrate learning velocity as much as results? Do we have psychological safety to fail fast?
X. Conclusion: The Only Advantage That Scales
Markets are becoming winner-take-most. The data makes this clear: 95% of the time, the winning vendor is already on the buyer’s Day One shortlist. Half of buyers now start their journey in AI chatbots. The median company spends $2 to acquire $1 of revenue while top performers spend $1.
The advantages that matter are those that compound; that become stronger with scale rather than diluting.
Search authority compounds. Each piece of quality content makes the next piece more valuable. Organizations optimizing for AI discovery see traffic growing at 40%+ monthly rates.
Signal intelligence compounds. Research shows 94% of buyers are using LLMs, yet only 11% of companies have their content AI-ready. Those tracking early signals gain 6–7 weeks of additional buyer engagement, often the difference between winning and losing.
Speed compounds. Organizations reviewing forecasts weekly are 31% more likely to close deals. Companies using AI see 20–30% conversion improvements and 15–20% better forecast accuracy. Each learning cycle makes the next cycle faster and more accurate.
Together, these three levers create the only sustainable growth advantage in modern markets: the ability to learn, adapt, and execute faster than competition.
The data from 2024–2025 reveals an unavoidable truth: the gap between top and bottom quartile performers has widened to 2.8x in capital efficiency. Customer acquisition costs have risen 222% over the past decade. Sales cycles are 25% longer than five years ago for those without systematic advantages.
The organizations that master this operating system won’t just hit their numbers. They’ll redefine what’s possible in their categories. They’ll attract the best talent. They’ll achieve the unit economics that enable sustainable growth. They’ll shape the conversations that define their markets.
Because in a world where everyone has access to the same channels, the same tools, and the same data, the differentiator is not what you have , it’s what you do with it.
The mediocre will keep producing content and waiting for pipeline.
The elite will engineer systems that turn market noise into signal, signal into action, and action into compounding competitive advantage.
About This Framework
This framework synthesizes publicly available research and benchmarking data from 2024–2025, including studies from 6sense, G2, Forrester, Benchmarkit, and other industry sources. The patterns identified represent observed market behaviors and performance metrics from organizations across various industries and growth stages.
The principles are industry-agnostic but application-specific. Every market has unique dynamics, but the underlying physics of growth remain constant: intelligence compounds, signals predict outcomes, and velocity creates leverage.
For organizations serious about building enduring competitive advantages in growth, the question is not whether to adopt systems thinking — it’s how quickly you can make the transition before the gap becomes insurmountable.
Press enter or click to view image in full size
References & Data Sources
This framework is supported by current research and benchmarking data from leading industry sources. All statistics and findings cited in this article are drawn from the following published reports and studies from 2024–2025.
Primary Research Sources
6sense Research: The 2025 B2B Buyer Experience Report — Global study of nearly 4,000 B2B buyers examining purchasing decisions, cycle lengths, and AI impact on buying behavior, https://6sense.com/science-of-b2b/buyer-experience-report-2025/, Key findings: Buying cycles, Day One shortlist importance, point of first contact shifts, AI adoption rates
G2 Research Reports
- 2024 Buyer Behavior Report: Proving Value in the Age of AI — Survey of 1,900+ B2B software buyers globally, https://research.g2.com/2024-buyer-behavior-report — Key findings: ROI expectations, AI adoption, shortlist behavior, trust and peer review importance
- How AI Chat is Rewriting B2B Software Buying (August 2025) — Survey of 1,000+ B2B software buyers on AI search behavior, https://learn.g2.com/ai-search-surging-for-b2b-buyers — Key findings: AI chatbot usage for research, ChatGPT preference, shortlist building behavior
Forrester Research: B2B Buyer Adoption of Generative AI (Report RES181769), https://www.forrester.com/report/b2b-buyer-adoption-of-generative-ai/RES181769 — Key findings: Enterprise AI adoption rates, impact on B2B purchasing processes
Benchmarkit / Maxio: 2025 SaaS Performance Metrics Benchmarks Report — Analysis of 500+ private B2B SaaS companies, https://www.benchmarkit.ai/2025benchmarks, https://www.maxio.com/blog/2025-saas-benchmark-report-trends — Key findings: CAC ratios, payback periods, expansion ARR trends, efficiency metrics
Phoenix Strategy Group: CAC Trends for Growth-Stage Companies 2025 — Analysis of customer acquisition cost trends, https://www.phoenixstrategy.group/blog/cac-trends-growth-stage-companies-2025 — Key findings: Quartile performance analysis, CAC ratio benchmarks
Content Marketing Institute (CMI) & MarketingProfs: B2B Content Marketing Benchmarks, Budgets, and Trends: Outlook for 2025 — Survey of 1,015 B2B marketers, https://contentmarketinginstitute.com/b2b-research/b2b-content-marketing-trends-research — Key findings: Content effectiveness, measurement challenges, AI adoption in content production
Supporting Industry Analysis
Digital Commerce 360: Forrester: AI Search Is Reshaping B2B Marketing (July 2025), https://www.digitalcommerce360.com/2025/07/11/forrester-ai-search-reshaping-b2b-marketing/ — Analysis of AI-driven traffic growth and B2B adoption rates
Martal Group: B2B Sales Cycle Length Benchmark (2024), https://martal.ca/sales-cycle-lb/ — Sales cycle trends and pipeline velocity analysis
Martal Group: B2B Sales Funnel Best Practices (2024), https://martal.ca/b2b-sales-funnel-lb/ — Content production and AI adoption in B2B sales
Coefficient: Sales Forecasting Best Practices (2024), https://coefficient.io/sales-forecasting-best-practices — Impact of forecast review cadence on deal closure rates
MarketsandMarkets: Revenue Intelligence vs. Traditional Sales Forecasting, https://www.marketsandmarkets.com/AI-sales/revenue-intelligence-vs-traditional-sales-forecasting — AI-driven forecasting accuracy improvements
Salesmate: Multi-Touch Attribution Guide (2024), https://www.salesmate.io/blog/multi-touch-attribution/ — Marketing attribution trends and adoption rates
inBeat Agency: Customer Acquisition Statistics (2024), https://inbeat.agency/blog/customer-acquisition-statistics — Long-term CAC trend analysis
Marketer: Customer Acquisition Cost (CAC): Why This Metric Can Make or Break Your Growth, https://www.marketer.com/blog/customer-acquisition-cost-cac-why-this-metric-can-make-or-break-your-growth — Conversion rate improvements from AI-powered personalization
Additional Benchmark Sources
High Alpha: 2025 SaaS Benchmarks Report — Early-stage SaaS company performance metrics, https://www.highalpha.com/saas-benchmarks
Pavilion: 2025 B2B SaaS Performance Benchmarks — CAC, NRR, and growth rate analysis, https://www.joinpavilion.com/resource/b2b-saas-performance-benchmarks
Salesforce Research: Weekly forecast review impact on deal closure rates (referenced in multiple industry publications, 2024)
Key Statistics by Category
AI & Search Impact
- 89% of B2B buyers adopted generative AI in less than two years (Forrester)
- 50% of software buyers now start their buying journey in an AI chatbot instead of Google Search — a 71% increase in four months (G2)
- B2B buyers are adopting AI-powered search at 3x the rate of consumers, with 90% of organizations using generative AI in purchasing (Digital Commerce 360/Forrester)
- AI-driven traffic represents 2–6% of total organic traffic, growing at over 40% per month (Digital Commerce 360)
- ChatGPT ranks as top LLM choice at 47% preference among buyers — nearly 3x any other LLM (G2)
Buyer Journey & Behavior
- 95% of the time, the winning vendor is already on the Day One shortlist (6sense)
- Buyers contact sellers at 61% through their journey, down from 69% — roughly 6–7 weeks earlier (6sense)
- Average buying cycle length dropped from 11.3 months (2024) to 10.1 months (2025) (6sense)
- 94% of buyers use LLMs to summarize reviews or analyze data (6sense)
- 58% of buyers said the need to evaluate AI capabilities caused them to engage earlier in the buying process (6sense)
Cost & Efficiency Metrics
- Top quartile SaaS companies spend ~$1.00 to acquire $1 of new ARR (Phoenix Strategy Group)
- Fourth quartile companies spend $2.82 for the same result (Phoenix Strategy Group)
- Median New CAC Ratio increased 14% in 2024 to reach $2.00 (Phoenix Strategy Group)
- Customer Acquisition Costs have surged 222% over the last decade (inBeat Agency)
- Organic search CAC ranges from $647 to $1,786 for B2B companies vs. $802 for paid search (Industry benchmarks)
- Average CAC payback period is 23 months for private SaaS companies (Benchmarkit)
Sales Cycle & Pipeline
- 43% of B2B sales leaders reported sales cycle length increased over the past 12 months (Martal Group)
- Companies reviewing forecasts weekly are 31% more likely to close deals successfully (Coefficient)
Attribution & Measurement
- 52% of marketers now report using multi-touch attribution, with 57% planning to increase use (Salesmate)
- 81% of organizations now measure content performance, up from 75% (CMI/MarketingProfs)
- Only 42% say their measurement approach is very effective (CMI/MarketingProfs)
AI-Driven Performance
- 57% of B2B companies reported leveraging generative AI to produce more content in less time as of 2024 (Martal Group)
- Companies using AI-powered chatbots and dynamic content personalization report 20–30% improvements in conversion rates (Marketer)
- AI-driven forecasting models reduce errors by an average of 15–20% compared to traditional methods (MarketsandMarkets)
Methodology Note
This framework synthesizes publicly available research and benchmarking data from 2024–2025. Where specific statistics are cited, they reflect the most recent published data available as of December 2025. Performance comparisons (e.g., “top quartile” vs. “fourth quartile”) are based on the respective research organizations’ segmentation methodologies as documented in their published reports.
The patterns identified represent observed market behaviors and performance metrics from organizations across various industries and growth stages. The principles outlined are industry-agnostic but application-specific; every market has unique dynamics, but the underlying physics of growth remain constant: intelligence compounds, signals predict outcomes, and velocity creates leverage.
For organizations serious about building enduring competitive advantages in growth, the question is not whether to adopt systems thinking — it’s how quickly you can make the transition before the gap becomes insurmountable.